Basic Usage
This document describes how to get started with eeweather.
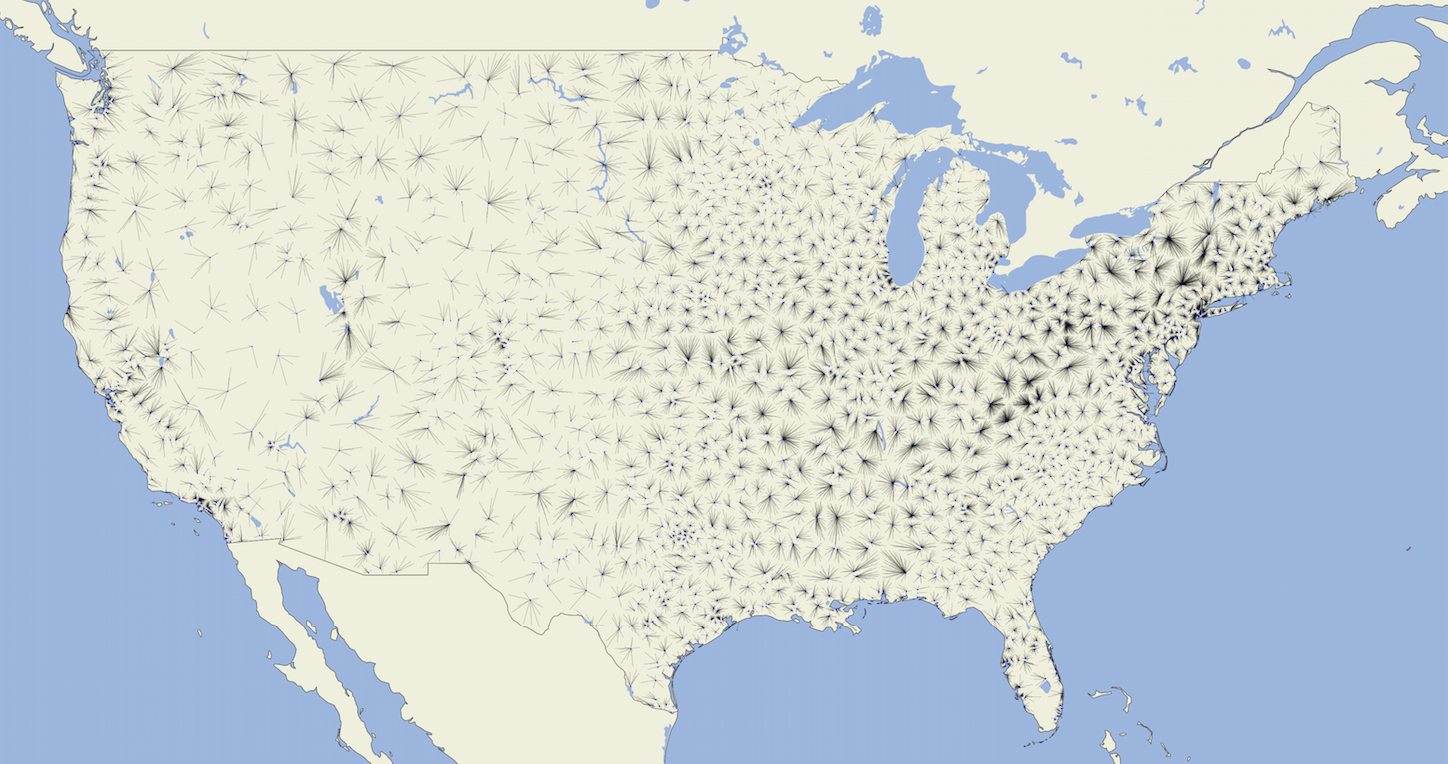
Matching to weather stations
EEweather is designed to support the process of finding sources of data that correspond to particular sites. As there are many approaches to this process of matching, the EEweather package is designed to be flexible.
EEweather provides sensible default mappings from geographical markers to weather stations so that it can be used out of the box.
EEweather uses lat/long coordinates as targets for weather matching. This method is described below.
Latitude/Longitude Coordinates
The recommended way to find the weather station(s) that correspond to a particular site is to use the lat-long coordinates of that site.
Example usage:
>>> import eeweather
>>> ranked_stations = eeweather.rank_stations(35, -95)
>>> station, warnings = eeweather.select_station(ranked_stations)
>>> station
ISDStation('720627')
>>> ranked_stations.loc[station.usaf_id]
rank                                     1
distance_meters                    32692.7
latitude                            35.283
longitude                            -95.1
iecc_climate_zone                        3
iecc_moisture_regime                     A
ba_climate_zone                Mixed-Humid
ca_climate_zone                       None
rough_quality                          low
elevation                            183.2
state                                   OK
tmy3_class                            None
is_tmy3                              False
is_cz2010                            False
difference_elevation_meters           None
Name: 720627, dtype: object
>>> warnings
[]
That particular result has no associated warnings, but other mappings may have associated warnings, such as the mapping from this point which is in the middle of the Gulf of Mexico, 700km away from the nearest weather station and outside of the climate zone boundary:
>>> ranked_stations = eeweather.rank_stations(20, -95)
>>> station, warnings = eeweather.select_station(ranked_stations)
>>> warnings
['Distance from target to weather station is greater than 50km.', 'Distance from target to weather station is greater than 200km.']
ZIP Code Tabulation Areas (ZCTAs)
ZIP codes are often abused as rough geographic markers. They are not
particularly well set up be used as the basis of a GIS system - some ZIP codes
correspond to single buildings or post-offices, some cover thousands of square
miles of land. The US Census Bureau transforms census blocks into what they
call ZIP Code Tabulation Areas, and use these instead. There are roughly 10k
ZIP codes that are not used as ZCTAs, and ZCTAs do not correspond directly to
ZIP codes, but for matching to weather stations, which are much sparser than
ZIP codes, this rough mapping is usually sufficient. Often tens or hundreds of
ZCTAs will be matched to the same weather station. We provide a function
eeweather.zcta_to_lat_long which allows for a ZCTA to be converted into
a latitude and longitude (the centroid of the ZCTA) which can be used to match
to a weather station using the latitude/longitude method mentioned above.
Note
The default mapping concentrates on weather stations in US states (including AK, HI) and territories, including PR, GU, VI etc).
Example usage:
>>> lat, long = eeweather.zcta_to_lat_long('91104')
>>> lat, long
(34.1678418058534, -118.123485581459)
Obtaining temperature data
These matching results carry a reference to a weather station object. The weather station object has some associated metadata and - most importantly - has methods for obtaining weather data.
Let’s look at the station object from above:
>>> station = result.isd_station
>>> station
ISDStation('722178')
This ISDStation object carries information about that station and methods
for fetching corresponding weather data.
The .json() method gives a quick summary of associated metadata in a
format that can easily be serialized:
>>> import json
>>> print(json.dumps(station.json(), indent=2)
{
  "elevation": 137.5,
  "latitude": 35.021,
  "longitude": -94.621,
  "icao_code": "KRKR",
  "name": "ROBERT S KERR AIRPORT",
  "quality": "high",
  "wban_ids": [
    "53953",
    "99999"
  ],
  "recent_wban_id": "53953",
  "climate_zones": {
    "iecc_climate_zone": "3",
    "iecc_moisture_regime": "A",
    "ba_climate_zone": "Mixed-Humid",
    "ca_climate_zone": null
  }
}
Most of these are also stored as attributes on the object:
>>> station.usaf_id
'722178'
>>> station.latitude, station.longitude
(35.021, -94.621)
>>> station.coords
(35.021, -94.621)
>>> station.name
'ROBERT S KERR AIRPORT'
>>> station.iecc_climate_zone
'3'
>>> station.iecc_moisture_regime
'A'
In addition to these simple attributes there are a host of methods that can be used to fetch temperature data. The simplest are these, which return pandas.Series objects. The start and end date timezones must be explicilty set to UTC.
Note that this temperature data is given in degrees Celsius, not Fahrenheit. (\(T_F = T_C \cdot 1.8 + 32\)), and that the pd.Timestamp index is given in UTC.
ISD temperature data as an hourly time series:
>>> import datetime
>>> import pytz
>>> start_date = datetime.datetime(2016, 6, 1, tzinfo=pytz.UTC)
>>> end_date = datetime.datetime(2017, 9, 15, tzinfo=pytz.UTC)
>>> tempC = station.load_isd_hourly_temp_data(start_date, end_date)
>>> tempC.head()
2016-06-01 00:00:00+00:00    21.3692
2016-06-01 01:00:00+00:00    20.6325
2016-06-01 02:00:00+00:00    19.4858
2016-06-01 03:00:00+00:00    19.0883
2016-06-01 04:00:00+00:00    18.8858
Freq: H, dtype: float64
>>> tempF = tempC * 1.8 + 32
>>> tempF.head()
2016-06-01 00:00:00+00:00    70.46456
2016-06-01 01:00:00+00:00    69.13850
2016-06-01 02:00:00+00:00    67.07444
2016-06-01 03:00:00+00:00    66.35894
2016-06-01 04:00:00+00:00    65.99444
ISD temperature data as a daily time series:
>>> tempC = station.load_isd_daily_temp_data(start_date, end_date)
>>> tempC.head()
2016-06-01 00:00:00+00:00    21.329063
2016-06-02 00:00:00+00:00    21.674583
2016-06-03 00:00:00+00:00    22.434306
2016-06-04 00:00:00+00:00    22.842674
2016-06-05 00:00:00+00:00    21.850521
Freq: D, dtype: float64
>>> tempF = tempC * 1.8 + 32
>>> tempF.head()
2016-06-01 00:00:00+00:00    70.392313
2016-06-02 00:00:00+00:00    71.014250
2016-06-03 00:00:00+00:00    72.381750
2016-06-04 00:00:00+00:00    73.116813
2016-06-05 00:00:00+00:00    71.330937
Freq: D, dtype: float64
GSOD temperature data as a daily time series:
>>> tempC = station.load_gsod_daily_temp_data(start_date, end_date)
>>> tempC.head()
2016-06-01 00:00:00+00:00    21.111111
2016-06-02 00:00:00+00:00    21.833333
2016-06-03 00:00:00+00:00    22.277778
2016-06-04 00:00:00+00:00    22.777778
2016-06-05 00:00:00+00:00    21.833333
Freq: D, dtype: float64
>>> tempF = temps * 1.8 + 32
>>> tempF.head()
2016-06-01 00:00:00+00:00    70.0
2016-06-02 00:00:00+00:00    71.3
2016-06-03 00:00:00+00:00    72.1
2016-06-04 00:00:00+00:00    73.0
2016-06-05 00:00:00+00:00    71.3
Freq: D, dtype: float64
This station does not contain TMY3 data. To require that TMY3 data is available at the matched weather station, restrict the ranked weather stations to only those which have TMY3 data:
>>> ranked_stations = eeweather.rank_stations(35, -95, is_tmy3=True)
>>> station, warnings = eeweather.select_station(ranked_stations)
>>> station
ISDStation('723440')
TMY3 temperature data as an hourly time series:
>>> tempC = station.load_tmy3_hourly_temp_data(start_date, end_date)
>>> tempC.head()

2016-06-01 00:00:00+00:00    26.7
2016-06-01 01:00:00+00:00    26.3
2016-06-01 02:00:00+00:00    26.0
2016-06-01 03:00:00+00:00    25.6
2016-06-01 04:00:00+00:00    25.3
Freq: D, dtype: float64
>>> tempF = temps * 1.8 + 32
>>> tempF.head()
2016-06-01 00:00:00+00:00    80.06
2016-06-01 01:00:00+00:00    79.34
2016-06-01 02:00:00+00:00    78.80
2016-06-01 03:00:00+00:00    78.08
2016-06-01 04:00:00+00:00    77.54
Freq: D, dtype: float64
A similar restriction can be made for CZ2010 stations, which are specific to California:
>>> ranked_stations = eeweather.rank_stations(35, -95, is_cz2010=True)
>>> station, warnings = eeweather.select_station(ranked_stations)
>>> station
ISDStation('723805')
CZ2010 temperature data as an hourly time series:
>>> tempC = station.load_cz2010_hourly_temp_data(start_date, end_date)
>>> tempC.head()
2016-06-01 00:00:00+00:00    26.7
2016-06-01 01:00:00+00:00    26.3
2016-06-01 02:00:00+00:00    26.0
2016-06-01 03:00:00+00:00    25.6
2016-06-01 04:00:00+00:00    25.3
Freq: D, dtype: float64
>>> tempF = temps * 1.8 + 32
>>> tempF.head()
2016-06-01 00:00:00+00:00    80.06
2016-06-01 01:00:00+00:00    79.34
2016-06-01 02:00:00+00:00    78.80
2016-06-01 03:00:00+00:00    78.08
2016-06-01 04:00:00+00:00    77.54
Freq: H, dtype: float64
The station ranking function eeweather.rank_stations has many more
options, including distance restriction and climate zone restriction, which
may come in handy.
If desired, eeweather.ISDStation objects can also be created directly:
>>> eeweather.ISDStation('722880')
ISDStation('722880')
If the station is not recognized, an error will be thrown:
>>> eeweather.ISDStation('BAD_STATION')
...
eeweather.exceptions.UnrecognizedUSAFIDError: BAD_STATION
